Running out of a popular product means losing sales. Ordering too much means money gets stuck in inventory .
For retailers, finding the right balance has always been difficult. Customer demand can change quickly because of promotions, seasons, weather, trends, and unexpected events. Traditional forecasting methods often struggle to keep up.
This is where AI demand forecasting can help. By analyzing sales history along with pricing, promotions, inventory, weather, and other demand signals, AI can help retailers predict what customers are likely to buy and plan inventory more accurately.
But how does it actually work? What data does it need? How accurate is it, and what does it cost to implement?
This guide answers these questions and explains how retailers can use AI demand forecasting to reduce stockouts, avoid excess inventory, and make smarter stocking decisions.
What AI Demand Forecasting Actually Is
AI demand forecasting uses AI and machine learning to predict how much of a product customers are likely to buy. It looks at past sales, current inventory, prices, promotions, seasons, and other factors to spot demand patterns. This helps retailers know what to stock, how much to order, and when to reorder, reducing both stockouts and excess inventory.
For a closer look at how this works in practice, see our guide to AI inventory management software development.
Why Traditional Retail Forecasting Keeps Failing? 7 Reasons
Traditional forecasting often relies on past sales, spreadsheets, and manual decisions. These methods can work in stable markets, but they struggle when demand changes quickly. Here are the main reasons:
1. Last Season’s Sales Are a Rear-View Mirror
Past sales can help predict future demand, but customer needs change. Prices, trends, weather, and competition can quickly affect what people buy.
2. Spreadsheets Cannot Handle Everything
Spreadsheets may work for a small number of products, but managing thousands of SKUs across multiple stores can make them difficult to manage and easy to get wrong.
3. Stockouts Hide Real Demand
When a product sells out, sales data only shows what you sold, not how many more customers wanted it. This can lead to ordering too little the next time.
4. Data Sits in Different Systems
Sales, inventory, ecommerce, warehouse, and supplier data often sit in separate systems. When this data is not connected, creating an accurate forecast becomes harder.
5. Promotions Can Distort Demand
A discount can suddenly increase sales. If the forecast treats this temporary spike as normal demand, retailers may order too much after the promotion ends.
6. Forecasts Can Become Outdated Quickly
Demand can change faster than weekly or monthly forecasting cycles. Trends, weather, and promotions can shift sales before the next forecast is ready.
7. Buyer Decisions Can Be Influenced by Personal Judgment
Experienced buyers bring valuable knowledge, but personal preferences and past experiences can also affect orders. A data-based forecast gives them a more reliable starting point.
How AI Demand Forecasting Works, Layer by Layer
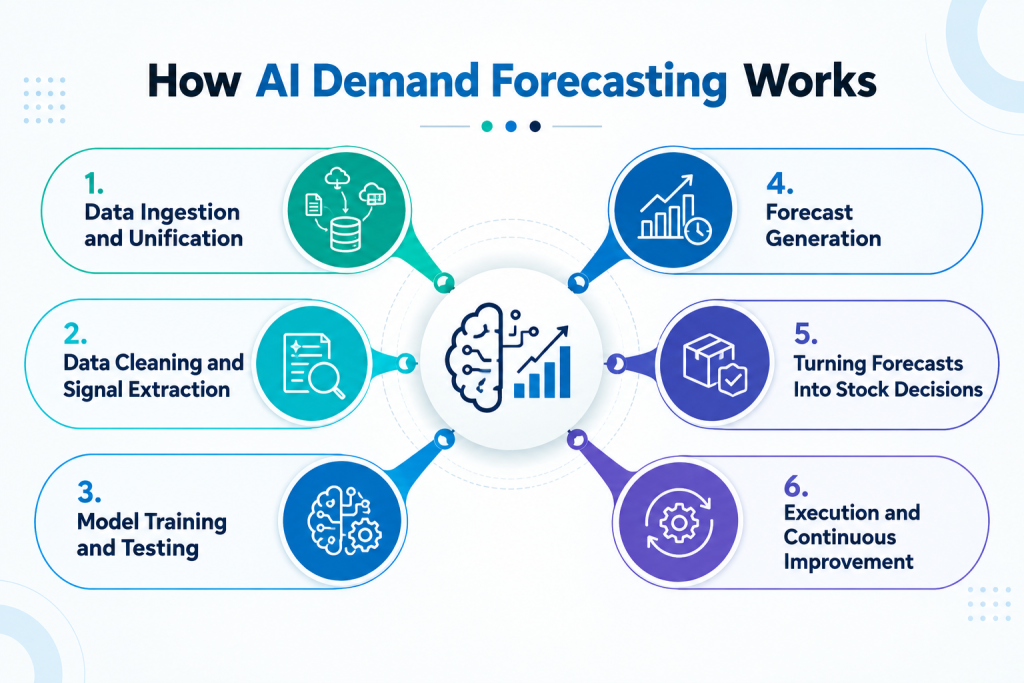
AI demand forecasting follows a few key steps, from collecting data to turning predictions into inventory decisions.
1. Data Ingestion and Unification
First, the system collects data from POS, e-commerce, warehouses, and suppliers. It brings this data together in one place and organizes it by product, location, and date.
2. Data Cleaning and Signal Extraction
Next, the data is cleaned to remove duplicates, errors, and incorrect records. Our data analysis and engineering services cover exactly this layer — from raw ingestion to clean, model-ready signals. The system also looks at factors such as promotions, prices, seasons, weather, and stockouts that can affect demand.
3. Model Training and Testing
The AI model learns from past data and is tested on data it has not seen before. Different products may need different models, depending on how their demand changes.
4. Forecast Generation
Once the model is ready, it predicts demand for each product, store, and sales channel. It can also provide a demand range to show how much sales may vary.
5. Turning Forecasts Into Stock Decisions
The forecast is then used to decide how much stock to keep and when to reorder. The system can consider supplier lead times, minimum order quantities, safety stock, and available storage space.
6. Execution and Continuous Improvement
Finally, the recommendations can be sent to the ERP, warehouse, or purchasing system. As new sales data comes in, the AI learns from it and updates future forecasts. Regular monitoring also helps keep the model accurate as customer demand changes.
The Real Cost of Getting It Wrong
IHL Group’s research puts the global cost of inventory distortion at $1.77 trillion. That figure covers the combined damage from out-of-stocks and overstocks. Out-of-stocks account for the larger share of that loss, and both sides of the problem come from the same weak forecast.
1. What a Stockout Actually Costs You
You lose the sale, and frequently you lose the customer behind it. Shoppers who cannot find an item switch brands or switch retailers, and many never return to check again. The margin loss is visible, while the loyalty loss shows up quietly across the next several quarters.
2. What Overstock Quietly Costs You
Excess stock feels safer than an empty shelf, which is precisely why it spreads. Every unsold unit locks up working capital, occupies warehouse space, and adds handling and insurance costs. That capital could have funded faster-moving lines instead of sitting still.
3. The Third Cost Nobody Budgets For
Overstock eventually becomes markdown, and markdown eventually becomes write-off. Seasonal goods, perishables, and fashion lines lose value on a fixed clock that no discount campaign can pause. Retailers rarely budget for this properly, so it lands as an unpleasant surprise at year-end.
| Impact area | Stockout | Overstock |
|---|---|---|
| Revenue | Sale lost immediately | Sale made at reduced margin |
| Margin | Zero contribution | Eroded by markdowns |
| Working capital | Freed but unproductive | Locked in unsold units |
| Customer effect | Switching and trust damage | Discount-trained buyers |
| Recovery time | Weeks to rebuild loyalty | One to three seasons to clear |
Forecasting Methods Compared: Statistical, Machine Learning, Deep Learning and Demand Sensing
| Method | How it works | Data it needs | Best fit | Where it breaks |
|---|---|---|---|---|
| Classical statistical | Projects trend and seasonality from past sales | 2 to 3 years of clean history | Stable, high-volume staples | Promotions, new products, sudden shifts |
| Machine learning | Learns patterns across many variables at once | History plus price, promo, weather, events | Most retail assortments | Thin data and poorly engineered features |
| Deep learning | Models long sequences and cross-product effects | Large, dense, multi-year datasets | Huge SKU counts, complex seasonality | Small catalogues, limited engineering capacity |
| Demand sensing | Reads live signals to correct the near-term view | Daily POS, clickstream, stock feeds | Short-horizon replenishment | Long-range planning and capacity decisions |
| Probabilistic forecasting | Predicts a distribution instead of one number | Any of the above, plus variance history | Safety stock and service level calls | Teams expecting a single tidy figure |
The Data You Need Before AI Can Forecast Anything
AI forecasting is only as good as the data behind it. To make useful predictions, retailers need clean and reliable data from different parts of the business.
1. Transaction and POS History
Sales data should include the product, date, quantity, price, and location. Two to three years of history is ideal, especially for products with seasonal demand.
2. Product and SKU Master Data
Product information should be accurate and consistent. Duplicate SKUs, missing details, and different product codes can lead to inaccurate forecasts.
3. Inventory and Stock Movement Records
AI needs to know when products were in stock and when they were unavailable. Stock levels, receipts, transfers, and adjustments help the model understand actual demand.
4. Supplier Lead Times and Order Constraints
Supplier data helps determine when and how much to reorder. Include lead times, minimum order quantities, case sizes, and supplier reliability.
5. Promotion, Pricing and Markdown Data
The model needs to know when products were discounted or promoted. This helps AI understand whether a sales increase was temporary or part of normal demand.
6. Store, Channel and Location Data
The same product may sell differently across stores and channels. Store location, store type, online sales, and customer traffic can help AI make more accurate local forecasts.
7. External Signals
Weather, holidays, local events, search trends, and other outside factors can also affect demand. Applying the right data analytics techniques to these signals helps the model understand why customer demand changes.
Where AI Demand Forecasting Pays Off in Retail Operations
AI can predict where products are most likely to sell. Retailers can then move stock to the right stores or fulfillment centers before shortages happen.
1. Omnichannel Inventory Allocation
AI can predict where products are most likely to sell. Retailers can then move stock to the right stores or fulfillment centers before shortages happen. Choosing the right platform matters here — our comparison of Magento vs Shopify vs WooCommerce covers how each handles inventory across channels.
2. Automated Replenishment and Purchase Orders
AI can help automate routine reorders based on demand, stock levels, and supplier lead times. Planners can focus on unusual orders instead of checking every item manually.
3. Safety Stock and Service Level Optimisation
AI can help retailers decide how much extra stock to keep for each product. This can reduce unnecessary inventory while keeping important products available.
4. Promotion, Pricing and Markdown Planning
AI can analyze past promotions and price changes to predict their impact on sales. This helps retailers plan discounts and markdowns without carrying too much leftover stock.
5. New Product Forecasting
New products have no sales history, making them difficult to forecast. AI can compare them with similar products to create an initial demand estimate and improve it as sales data becomes available.
6. Perishables and Shelf-Life Management
For products with a short shelf life, accurate forecasts can help retailers order closer to actual demand. This can reduce waste while keeping enough products available.
7. Supplier Collaboration and Lead Time Risk
AI can help retailers predict future demand and share better estimates with suppliers. It can also identify suppliers whose delivery times are becoming unreliable. Retailers in regulated categories can also apply these principles to medical supply chain management.
8. What-If Scenario Planning
Retailers can use AI to test different situations before making decisions. For example, they can see what may happen if prices change, a promotion runs, or a supplier delivery is delayed.
Not Sure Which AI Inventory Management Approach Fits Your Business?
Our retail AI specialists will audit your forecasting process and recommend the right model — pilot to enterprise.
Book a Free AI Demand Forecasting Consultation →How to Measure Whether the Forecast Is Actually Good
| Metric | What it answers | Healthy direction |
|---|---|---|
| MAPE / WMAPE | How wrong are we on average | Falling, weighted by volume |
| Forecast bias | Do we consistently over or under-predict | Close to zero |
| Forecast value added | Is the model beating a simple baseline | Positive and sustained |
| Service level/fill rate | Are we meeting demand when it arrives | Rising toward target |
| Inventory turns | How hard is our stock working | Rising without hurting availability |
| Stockout rate | How often do we go empty | Falling on priority lines |
| Markdown rate | How much margin are we discounting away | Falling season on season |
Where AI Demand Forecasting Still Fails
AI demand forecasting can improve inventory planning, but it is not perfect. Some situations still make accurate predictions difficult.
- New Products With No Sales History: New products have no past sales data to learn from. AI can use similar products to make an initial estimate, but the forecast becomes more accurate only after real sales data comes in.
- Long-Tail and Irregular Demand: Products that sell only a few times a month do not provide enough data for AI to find clear patterns. Simple reorder rules may work better for these products.
- One-Off Events and Sudden Changes: Unexpected events, such as new regulations, major disruptions, or sudden competitor changes, are difficult to predict because there is little or no past data to learn from. More advanced approaches using generative AI development are beginning to close this gap by synthesising plausible scenarios from limited signals.
- Promotion Cannibalisation and Halo Effects: A promotion can increase sales of one product while reducing sales of similar products. Understanding these effects can be difficult without good promotion data.
- Dirty Master Data and Duplicate SKUs: Incorrect product information or duplicate SKUs can confuse the model and lead to poor forecasts. Clean and consistent data is essential.
- Model Drift After Go-Live: Customer behaviour can change over time, which can make an old model less accurate. Regular monitoring and retraining are needed to keep forecasts useful.
- Forecasts Nobody Acts On: Even an accurate forecast will not help if teams do not use it. Retailers need clear workflows and ownership to turn AI predictions into real inventory decisions.
Implementation Roadmap: From Pilot to Production
Implementing AI demand forecasting does not have to happen all at once. Start small, test the results, and then expand.
Step 1. Clean Your Data First
Start by checking your sales, inventory, and supplier data. Remove duplicate records, fix errors, and make sure product information is consistent.
Step 2. Start With One Product Category
Do not try to forecast every product at once. Choose one category with enough sales data and a clear forecasting problem. This makes the first project easier to manage.
Step 3. Set a Starting Benchmark
Check how accurate your current forecasting process is before introducing AI. This gives you a clear number to compare against later.
Step 4. Build and Test the AI Model
Train the AI using your historical data and test how well it predicts demand. Understanding the full AI software development process helps teams set realistic timelines and avoid common pitfalls. Try different models and choose the one that works best for your products.
Step 5. Compare AI With Your Current Process
Run the AI forecast alongside your existing method for a few weeks or planning cycles. This helps your team compare the results and build confidence in the new system.
Step 6. Connect AI to Your Inventory System
Once the results are reliable, connect the forecast to your ERP, purchasing, or inventory system. Our ERP CRM solutions are built to accept these forecast feeds and convert them into automated purchase triggers. This allows the recommendations to support real ordering and replenishment decisions.
Step 7. Expand and Keep Improving
After proving the results with one category, expand to more products and locations. Keep monitoring accuracy and update the model regularly as demand patterns change.
Now that the delivery path is clear, the next decision is who builds and runs it.
Build, Buy or Hybrid: Choosing Your AI Demand Forecasting Approach
| Factor | Buy a platform | Build custom | Hybrid |
|---|---|---|---|
| Speed to first value | Fastest | Slowest | Moderate |
| Fit to your assortment | Generic | Tailored | Tailored where it counts |
| Integration depth | Limited by connectors | Complete | Complete on custom layers |
| Data ownership | Shared with vendor | Fully yours | Fully yours |
| Ongoing cost shape | Recurring licence | Engineering and hosting | Mixed |
| Best fit | Standard retail, small teams | Unusual models, scale, differentiation | Most mid-market retailers |
1. Buying an Off-the-Shelf Forecasting Module
An off-the-shelf tool can get you started quickly with ready-made forecasting features. It works well for standard needs, but may not support complex business rules or custom integrations. Our breakdown of Shopify vs custom ecommerce development illustrates exactly this trade-off in a retail context.
2. Building a Custom AI Demand Forecasting System
A custom system is built around your specific products, data, and processes. It offers more flexibility and control, but requires more time, development, and ongoing maintenance.
3. The Hybrid Model Most Retailers Land On
A hybrid approach combines a ready-made forecasting tool with custom AI where needed. This gives retailers faster implementation while still allowing them to handle specific or complex forecasting needs.
What AI Demand Forecasting Costs and How Long It Takes
| Scope band | What it covers | Indicative range | Indicative timeline |
|---|---|---|---|
| Pilot on one category | Data audit, baseline, model, backtest, dashboard | $25,000 to $60,000 | 6 to 10 weeks |
| Production engine, single channel | Pipelines, models, ERP read and write, monitoring | $60,000 to $150,000 | 3 to 5 months |
| Multi-channel platform | Multi-site forecasting, allocation, automated replenishment | $150,000 to $400,000 | 5 to 9 months |
| Enterprise programme | Full MLOps, governance, managed retraining, change management | $400,000 and above | 9 to 18 months |
Why DreamSoft4U for AI Demand Forecasting
Forecasting is a data engineering problem wearing an AI badge, and that is precisely where our strength sits. DreamSoft4u builds the pipelines, models, and integrations that turn predictions into purchase orders.
- 23+ years of engineering delivery: Two decades of building production systems for global clients, not pilots that stall after the demo
- 1,600+ projects delivered: Proven execution across retail, ecommerce, logistics, healthcare, and fintech programmes
- 100+ engineers across the US and India: Data engineers, ML specialists, and integration developers working as one delivery team
- Full-stack AI capability: AI and machine learning development covering models, agentic workflows, and automation
- Deep integration experience: ERP, POS, WMS, EDI, and marketplace connectivity handled by teams who have shipped against each
- Outcome-led engagements: Defined success metrics, phase gates, and transparent reporting from kickoff onward
- Flexible delivery models: Dedicated squads or staff augmentation, scaled to the phase you are actually in
Ready to Turn Your Demand Data Into Stock Decisions You Can Trust?
DreamSoft4U has delivered 1,600+ projects across retail, ecommerce, and logistics. Let’s build your AI demand forecasting engine — from pilot to production.
Connect With Our ExpertsConclusion
Retailers can stop guessing, though not by buying a model and hoping. AI demand forecasting works when clean data, well-chosen methods, honest accuracy measurement, and real system integration come together in one programme.
The technology is mature, and the discipline around it is what separates a working system from an expensive dashboard. Start with one category, measure against a real baseline, and expand from proof rather than from optimism.
We hope this guide helped you understand what AI demand forecasting genuinely involves, where it delivers, and where it still struggles.
Now it is your turn to look at your own stock position and ask which of the seven failure points you recognise.
Frequently Asked Questions
It is the use of machine learning to predict product-level demand by store, channel, and time period. The models learn from sales, stock, pricing, and external signals, then update continuously as new data arrives.
Accuracy depends on data quality and product behaviour, so ranges vary widely. McKinsey’s Supply Chain 4.0 research reports that forecasting errors often fall by 30% to 50% once predictive analytics enters demand planning.
Two to three years of item-level daily sales is the comfortable starting point for seasonal accuracy. Shorter histories still work for stable products, and new items rely on attribute-based similarity instead.
Yes, and integration is usually the larger share of the work. Modern systems connect through APIs, while older platforms are bridged with middleware so no replacement is needed.
A focused pilot on one category typically runs 6 to 10 weeks. A production system across channels usually takes 3 to 9 months, with most of that time spent on data and integration.
Custom pilots generally start in the mid-five-figure range, while multi-channel platforms run into six figures. Final cost depends on SKU count, data condition, integration scope, and how much replenishment you automate.